
🚨https://daytradetowin.com
Free Member Access: https://daytradetowin.com/free/
🚀 Ninja Trader free Access: https://ninja.daytradetowin.com/
🚀Trading View Access: https://www.tradingview.com/?aff_id=20739
Email: [email protected] OR call 1-888-607-0008
Lifetime Access: https://daytradetowin.com/day-trading-mentorship-coach/
New PDT Stock trading rule: https://daytradetowin.com/pattern-day-trader-rule/
Email: [email protected] OR call 1-888-607-0008
Chapters
0:00 Intro to Market Cycles and Grouping Days
2:15 How to Anticipate the Type of Trading Day
4:30 Breaking Down the Day into ABC Sections
6:45 The Middle Session and Testing Support or Resistance
8:30 The Two Consecutive Candle Rule for Entry
11:15 Late Day Rallies and Market Reversals
13:00 Why Price Action Beats Using Too Many Indicators
15:45 Applying the Strategy to Oil and Stocks
17:30 Mentorship and Getting Started with Software
18:06 End of Video
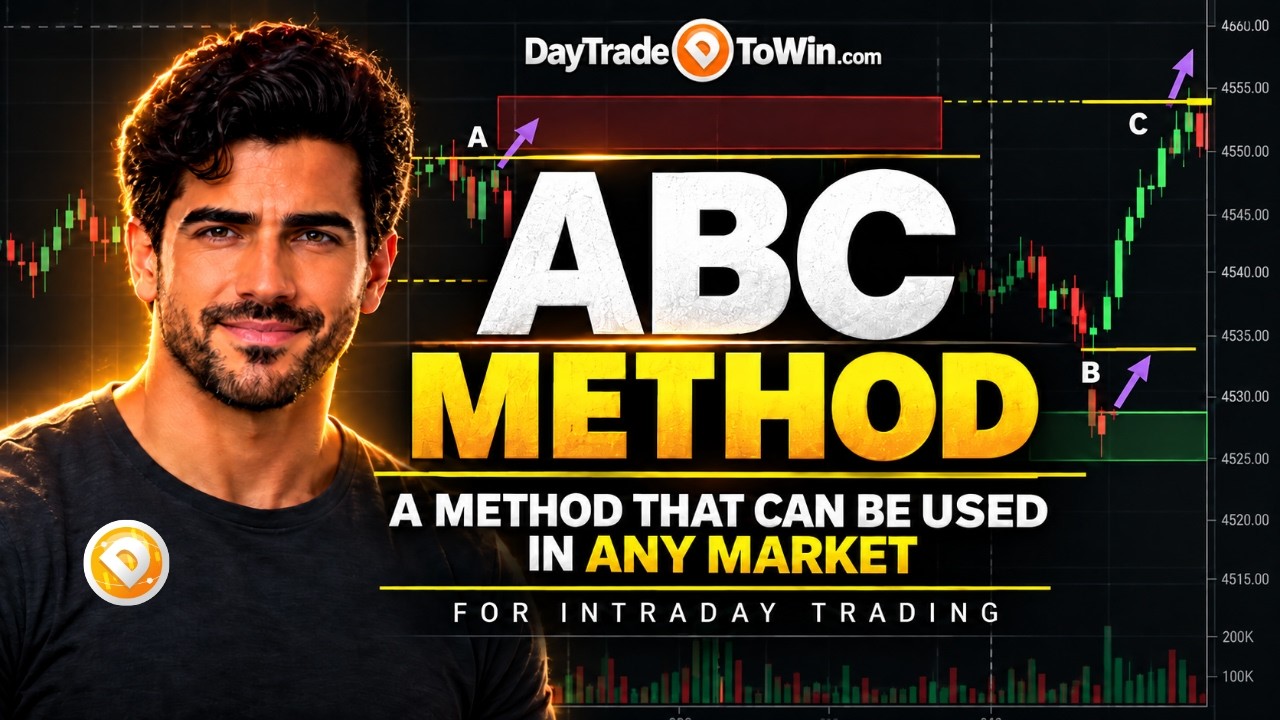
Can you tell if the market is about to trend or stay stuck in a trading range? Learn the ABC Trading Method, a simple price action strategy designed to help identify intraday breakouts, support and resistance, and potential trend days.
In this trading tutorial, John Paul from DayTradeToWin explains how to divide the trading session into three parts — A, B, and C — and use the price action within each section to make better-informed trading decisions.
🔥 WHAT YOU’LL LEARN:
✅ How to identify trending vs. range-bound markets
✅ The ABC Method for intraday trading
✅ How the first 2.5 hours establish important support and resistance levels
✅ Why TWO consecutive candle closes matter for confirming breakouts
✅ How to recognize false breakouts, double tops, and double bottoms
✅ How to identify potential late-day rallies and sell-offs
✅ How to trade price action without cluttering your charts with indicators
✅ How to apply the method to futures, stocks, and other markets
📊 HOW THE ABC TRADING METHOD WORKS
A — Morning Session (9:30 AM–12:00 PM ET)
Identify the initial trading range, including the session high and low.
B — Midday Session (12:00 PM–2:30 PM ET)
Watch for price to break above or below the A range, or test its support and resistance. Two consecutive candle closes outside the range provide confirmation of a potential breakout.
C — Afternoon Session (2:30 PM–4:00 PM ET)
Monitor whether the market continues trending, reverses, or stays range-bound into the close.
This approach can be adapted to E-mini S&P 500 (ES), Micro E-mini S&P 500 (MES), Nasdaq (NQ), Micro Nasdaq (MNQ), stocks, and other actively traded markets.
🎁 GET THE FREE ABC INDICATOR
You can download the ABC Indicator for NinjaTrader and TradingView through a free DayTradeToWin member account.
👉 https://daytradetowin.com/
We also offer price action trading education, trading indicators, automated trading software, and one-on-one mentorship for NinjaTrader and TradingView.
Explore our trading systems, including the Atlas Line, Sonic Trading System, Trade Scalper, At The Open, and Autopilot.
ABOUT DAYTRADETOWIN
DayTradeToWin specializes in price action trading education, helping traders understand market behavior through clearly defined strategies, chart-based examples, and practical trading rules.
Whether you’re a new trader or an experienced futures trader, this class will help you develop a more structured approach to analyzing the market.
Subscribe for additional day trading lessons, futures market analysis, price action strategies, and trading platform tutorials.
QUESTION FOR TRADERS:
Do you prefer trading trending markets or range-bound markets? Let us know in the comments.
#DayTrading #PriceActionTrading #TradingStrategy #FuturesTrading #NinjaTrader
*THE LINKS IN THIS DESCRIPTION ARE AFFILIATE LINKS. I DO BENEFIT FINANCIALLY WHEN YOU CLICK THESE LINKS AND SIGN UP WITH PARTNERS. THIS IS NOT FINANCIAL ADVICE. NEVER INVEST MORE THAN YOU’RE WILLING TO LOSE. DAY TRADING IS VERY DIFFICULT, AND THE PERFORMANCE SHOWN HERE ON YOUTUBE DOES NOT PORTRAY COMMON RESULTS.
None of the information contained herein constitutes a recommendation, promotion, offer, or solicitation of an offer to buy, sell or hold any security, financial product or instrument or to engage in any specific investment strategy. Investment involves risks. Investors should obtain their own independent financial advice and understand the risks associated with investment products and services before making investment decisions.