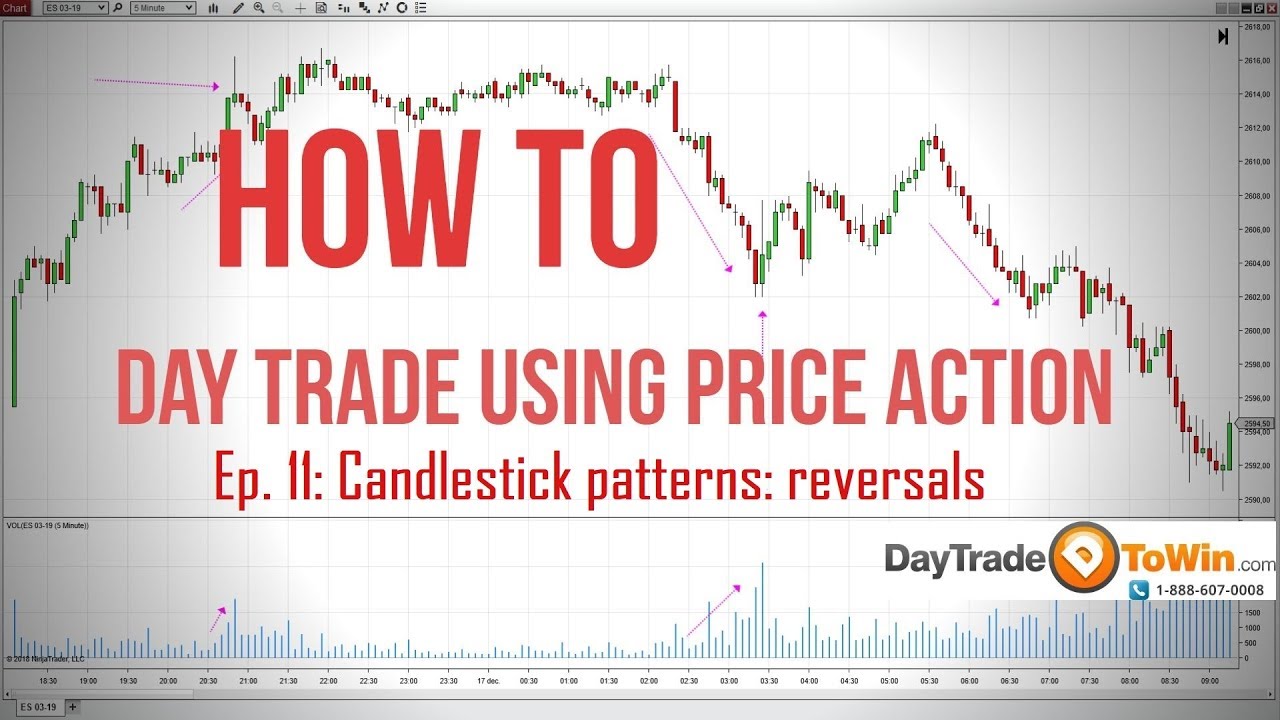
In the last week’s episode of how to day trade using price action, you gained an understanding about how the pricing of securities worked through my simplified and silly examples. We also analyzed the “Big Green Candle” and you understood what it genuinely infers when you see one of those immense green candles. I believe it is important to for you understand the mechanics behind the candles in your chart. Usually the Big Green Candles are found in strong uptrends, and they signal a continuation of the trend.
I didn’t analyze the “Big Red Candles”, however I realize you are entirely savvy, so you most likely already figured out that Big Red Candles are the inverse to Big Green Candles. At the end of the day the Big Red Candles are enormous bearish candles found in a down pattern. They can likewise be discovered at levels of support, when big strong moves are required for a break out. Same thing with Big green candles – they are often found at levels of resistance, and the big green candle represents the strong demand that is needed to break through the resistance.
We’ll cover lots more on this in the next video, so please subscribe to our Youtube channel, and please like this video by clicking the thumbs up! ?
And by the way, did you know we also offer day trading mentorship? The next 8-week mentorship program begins soon, so head over to daytradetowin.com to sign up now while there are seats available.
